Two separate measurements, not one count
Dynamic QR activity is recorded when the managed QR address is requested. That address can also be opened as an ordinary link, so a recorded request does not prove that someone scanned a physical print. Hosted website visits are recorded separately when activity reaches the website’s tracking system. A visitor can reach that site through a QR or an ordinary link; a dynamic QR is not required to measure website visits.
The two records are not a matched list of the same visits. Do not assume that every QR request produces a recorded website view, or subtract scans from visits to estimate how many people arrived through ordinary links. Note each report’s period and scope before comparing activity, and keep the counts separate rather than combining them into a total audience.
How far back the figures go on each plan
Analytics history depends on the studio’s plan. Select the period you need in the report and note its dates alongside the result. A counter shown beside a saved code is not automatically a figure for that selected period. Check the report label before comparing it with another screen or with a note from an earlier week.
On a Free plan the studio has 7 days of analytics history available to review. On Lite SME the available window is 90 days. On Business the available window is also 90 days. If the team wants to look back more than a week, they will need access to a paid plan before they can compare that longer period.
Turn a combined count into a placement question
In the Analytics report, review the daily scan activity and hourly distribution for the selected QR and period. Note the dates of any busy periods alongside your own record of where the code was displayed. For a small number of recorded requests, describe the activity you see without treating it as a reliable pattern in customer behaviour.
If the same QR appears on all four surfaces, the combined count does not identify which one was used. Choose one practical experiment instead of declaring a winning placement: for example, change the position of the reception card and record the change date. Compare later activity over a clearly noted period, while acknowledging that other changes at the studio could also affect it. This is a suggested way to organise your own observations, not a QREasy feature that attributes scans to individual surfaces.
What the figures cannot tell the team
The figures do not identify individual scanners, do not confirm the reason a guest scanned and do not prove that any scan led to a booking. The analytics do not report a single customer's name, contact details or follow-up action, and the studio cannot use the counts to judge lead quality or sales causation on their own.
That means the team should treat the numbers as guidance for the next reprint decision, not as evidence about staff follow-up, conversion or marketing return. A busy week of scans can still include guests who only looked, and a quiet week of scans can still include a single confirmed appointment reached by phone or through an external booking link. The studio's own booking records, not the analytics, remain the source of truth for confirmed bookings.
Where to open these figures in QREasy
Sign in, open the account menu and choose Analytics. Choose Individual QR, select the code you want to review and check the Time Range. Read its Scan Trends and Hourly Distribution as QR activity. Website visits remain a separate measurement; the individual QR report does not show a matched list of visits to that code’s destination.
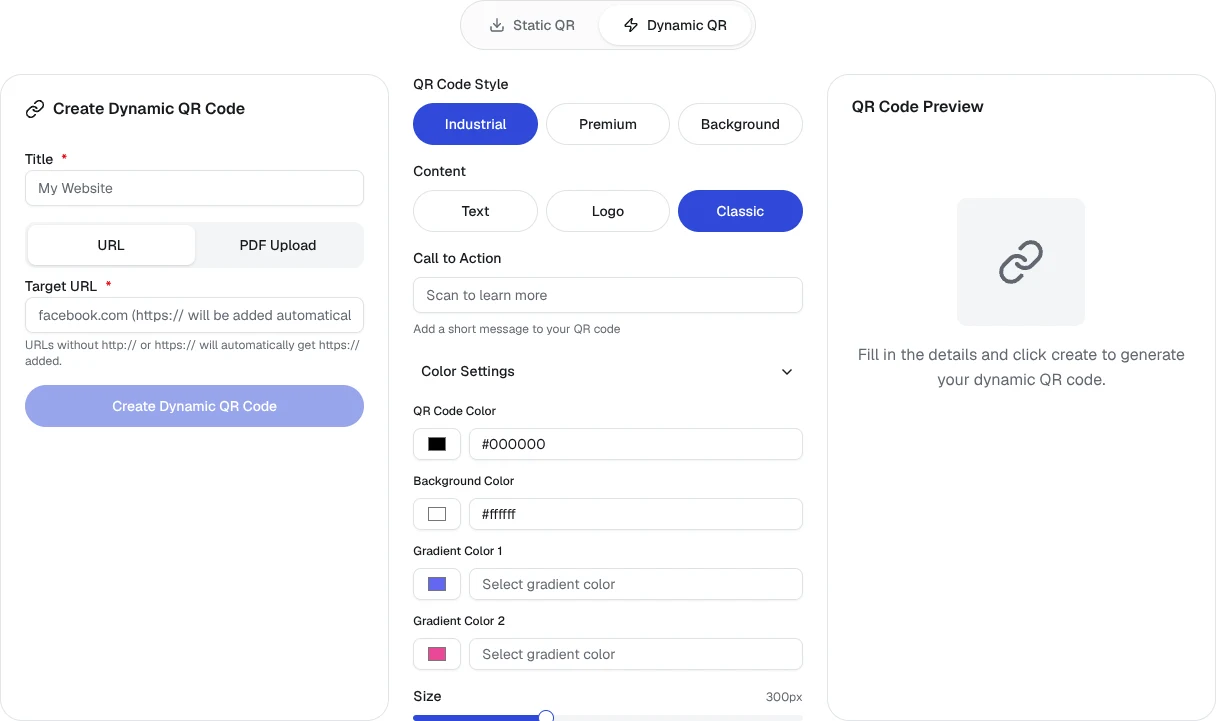
My QRs is the separate place to manage existing codes. It lists their counters and provides actions such as Edit and Download QR; it is not the individual analytics report. If you only need to read activity, keep using Analytics. The dynamic URL creation form below is for a new code when your next placement experiment needs one, subject to your plan limit; it does not change the code already printed.